Breakout LevelsBreakout Levels Indicator
The Breakout Levels indicator is a tool designed to help traders identify potential breakout points based on a specified time range and market volatility. By combining user-defined time frames with Average True Range (ATR) calculations, it provides actionable entry and stop-loss levels for both upward and downward breakouts. Additionally, it includes risk management features to calculate appropriate position sizes based on your account capital and risk tolerance.
Key Features
Custom Time Range Selection: Define a specific period during which the indicator calculates the highest high and lowest low to establish breakout levels.
ATR-Based Calculations: Use the ATR to adjust entry and stop-loss levels according to market volatility.
Risk Management: Automatically calculate position sizes based on your account capital and desired risk per trade.
Indicator Inputs
Start Time : The beginning of the time range for calculating the highest high and lowest low.
End Time : The end of the time range.
Entry Multiplier: A factor that determines how far the entry level is from the breakout level, scaled by the ATR.
Stop-Loss Multiplier: A factor that determines the distance of the stop-loss from the entry level, scaled by the ATR.
Risk per Trade (%) : The percentage of your account capital you're willing to risk on each trade.
Account Capital : Your total trading capital used for position size calculations.
ATR Length : The number of periods over which the ATR is calculated.
Position Size Up / Down : Shows you Lot size to maintain no loss more than allowed percentage at that entry
在腳本中搜尋"stop loss"

Bull Trade Zone IndicatorThe BULL TRADE ZONE INDICATOR is a powerful trading tool designed to help traders identify optimal entry and exit points in the market. This script uses a combination of two Exponential Moving Averages (EMA) and the Average True Range (ATR) to generate buy and sell signals, making it ideal for traders looking to enhance their trading strategy with precise and timely alerts.
Key Features:
Dynamic Buy and Sell Signals: The indicator generates buy signals when the 14 EMA crosses above the 150 EMA and the price is trading above the 150 EMA. Sell signals are generated when the 14 EMA crosses below the 150 EMA and the price is below the 150 EMA, providing clear guidance on potential market trends.
Built-In Stop-Loss Levels: Automatic stop-loss levels are calculated based on the ATR, helping traders manage risk effectively by setting realistic stop-loss points based on market volatility.
Minimal Chart Clutter: To maintain a clean and focused trading environment, the 14 EMA and 150 EMA values are privately used within the script without being visibly plotted on the chart, ensuring that the focus remains on actionable signals.
Clear Visual Alerts: Buy and sell signals are highlighted directly on the chart with intuitive labels, making it easy to spot trading opportunities at a glance.
Who Is This For?
This indicator is suitable for traders of all levels—whether you are a beginner looking for a straightforward trading tool or an experienced trader seeking to add an additional layer of confirmation to your strategy. The BULL TRADE ZONE INDICATOR helps you stay ahead of the market by precisely identifying key trading zones.
How to Use:
Add the indicator to your chart.
Monitor the buy and sell signals generated by the script.
Use the plotted stop-loss levels to manage your trades effectively.
Customize your trading strategy using the indicator’s signals to align with your risk appetite and market view.
Disclaimer:
This indicator is a technical analysis tool designed to assist with decision-making. It should be used alongside other analyses and strategies, not as the sole basis for trading decisions. Always perform your due diligence and risk management when trading.

Risk TrackerThis Risk Tracker Pine Script provides traders with a customizable tool for tracking and managing trade risk directly on their chart. The script is designed to accommodate both futures and crypto trades, allowing you to monitor risk and reward parameters, adjust contract sizes, and manage leverage in real-time.
Key Features:
1. Trade Direction and Risk-Reward Ratio:
• Select between Long or Short trade directions.
• Set a custom Risk-Reward Ratio (RRR) to calculate potential profit and loss levels based on your trade setup.
2. Customizable Parameters:
• Input fields for contract size, leverage, margin, and maximum drawdown allow you to adjust the risk settings depending on the market you are trading.
• You can toggle between using a dollar-based or percentage-based risk calculation depending on whether you’re trading futures (USD-based) or crypto.
3. Real-time Stop-Loss and Take-Profit Calculation:
• The script automatically calculates and draws the Stop-Loss (SL) and Take-Profit (TP) levels on the chart based on your entry price and selected risk settings.
• The color of the SL and TP lines is customizable, allowing you to visually distinguish profit and loss levels.
4. Historical Price Levels:
• If there is no active trade, the script scans historical price data to find the last instances when the price hit the predefined stop-loss or take-profit levels, helping you understand past price behavior.
5. Risk Management Table:
• A summary table is displayed on the chart, showing the key metrics of your trade, including:
• Tick value and Dollar value for futures.
• Margin and Leverage for crypto.
• Risk-Reward Ratio, Entry price, Risk and Profit in USD or percentage terms.
• The table dynamically updates based on the current trade status.
6. Extended Chart Visualization:
• Option to extend the SL and TP lines to the left of the chart, allowing you to easily view these levels across multiple timeframes and bars.
This script helps ensure you are always aware of your trade’s risk profile, providing a clear and visual representation of potential profit and loss, both in terms of percentage and dollar value. Ideal for futures and crypto traders who rely on precise risk management to maintain profitability.

Deep Crab Harmonic Pattern [TradingFinder] Reversal Zones🔵 Introduction
The Deep Crab pattern is a 5-point extension harmonic structure (X-A-B-C-D) used in technical analysis to identify potential reversal points in financial markets. Like the original Crab pattern, it heavily relies on a 1.618 XA projection to form the Potential Reversal Zone (PRZ).
However, the key difference lies in the B point, which must be an 0.886 retracement of the XA leg. The D point in this pattern typically extends beyond the X point, signaling a strong potential reversal in price movement.
Bullish Deep Crab :
The Bullish Deep Crab is a pattern used in technical analysis to spot potential trend reversals. It signals a shift from a downtrend to an uptrend. Traders enter a buy position at the D point and set a stop-loss below point X, anticipating a price increase.
Bearish Deep Crab :
The Bearish Deep Crab is a reversal pattern that indicates the potential end of an uptrend. Traders enter a sell position at point D and set a stop-loss above point X, expecting the price to fall afterward.
🟣 Crab Vs Deep Crab
The Crab and Deep Crab patterns are both used to identify reversal points in technical analysis, but they differ in terms of correction depth :
Crab : The B point retraces between 38.2% to 61.8% of the XA leg, and point D extends beyond X, indicating a price reversal after a smaller correction.
Deep Crab : The B point retraces more deeply, around 88.6% of the XA leg, and point D has a stronger extension, signaling a reversal after a deeper correction.
The Deep Crab is more suited for identifying stronger price movements.
🔵 How to Use
To effectively use the Deep Crab pattern, it’s essential to correctly identify its five key points (X, A, B, C, and D) based on Fibonacci retracements and extensions. Traders look for a deep retracement at point B, followed by an extended move to point D, which typically signals a strong price reversal.
Once these points are established, traders can strategically enter positions at point D with appropriate stop-loss and take-profit levels, capitalizing on the anticipated market reversal. Proper use of Fibonacci tools is crucial for accurate pattern identification.
🟣 Bullish Deep Crab
To use the Bullish Deep Crab pattern, a trader identifies point D as the key price reversal point in a downtrend. Using Fibonacci tools, points X, A, B, and C are identified, with point B showing an 88.6% retracement of XA, and CD extending 1.618% of XA.
The trader enters a buy position at point D and sets a stop-loss below X, expecting a reversal from a downtrend to an uptrend.
🟣 Bearish Deep Crab
In the Bearish Deep Crab pattern, point D acts as the reversal point in an uptrend. After identifying points X, A, B, and C, D extends 1.618% of XA. Point B retraces 88.6% of XA. Traders enter a sell position at point D and place a stop-loss above X, anticipating a drop in price.
🔵 Setting
🟣 Logical Setting
ZigZag Pivot Period : You can adjust the period so that the harmonic patterns are adjusted according to the pivot period you want. This factor is the most important parameter in pattern recognition.
Show Valid Forma t: If this parameter is on "On" mode, only patterns will be displayed that they have exact format and no noise can be seen in them. If "Off" is, the patterns displayed that maybe are noisy and do not exactly correspond to the original pattern.
Show Formation Last Pivot Confirm : if Turned on, you can see this ability of patterns when their last pivot is formed. If this feature is off, it will see the patterns as soon as they are formed. The advantage of this option being clear is less formation of fielded patterns, and it is accompanied by the latest pattern seeing and a sharp reduction in reward to risk.
Period of Formation Last Pivot : Using this parameter you can determine that the last pivot is based on Pivot period.
🟣 Genaral Setting
Show : Enter "On" to display the template and "Off" to not display the template.
Color : Enter the desired color to draw the pattern in this parameter.
LineWidth : You can enter the number 1 or numbers higher than one to adjust the thickness of the drawing lines. This number must be an integer and increases with increasing thickness.
LabelSize : You can adjust the size of the labels by using the "size.auto", "size.tiny", "size.smal", "size.normal", "size.large" or "size.huge" entries.
🟣 Alert Setting
Alert : On / Off
Message Frequency : This string parameter defines the announcement frequency. Choices include: "All" (activates the alert every time the function is called), "Once Per Bar" (activates the alert only on the first call within the bar), and "Once Per Bar Close" (the alert is activated only by a call at the last script execution of the real-time bar upon closing). The default setting is "Once per Bar".
Show Alert Time by Time Zone : The date, hour, and minute you receive in alert messages can be based on any time zone you choose. For example, if you want New York time, you should enter "UTC-4". This input is set to the time zone "UTC" by default.
🔵 Conclusion
The Deep Crab pattern is a valuable reversal tool in technical analysis, known for its deep retracement and extended price movements.
Unlike other harmonic patterns, it emphasizes identifying critical points where price action is likely to reverse sharply. This pattern works well in both bullish and bearish market scenarios, offering clear signals for entry and exit points.
However, successful application requires a deep understanding of market behavior and precise use of technical tools like Fibonacci retracement. Overall, mastering this pattern can enhance trading strategies and risk management.

Uptrick: Imbalance MA Trailing System
### **Overview**
The "Uptrick: Imbalance MA Trailing System" is a complex trading indicator designed to help traders identify potential bullish and bearish imbalances in the market, coupled with a trailing stop mechanism to manage trades. The indicator uses a combination of moving averages, Average True Range (ATR), and custom logic to detect trading signals and plot various levels on the chart to assist traders in making informed decisions.
### **Key Components and Functionality**
#### 1. **Inputs and Configuration**
- **Imbalance Filter (`imbalanceFilter`)**: This input sets the filter for detecting imbalances based on the difference between two price points. The value is a float and can be adjusted to fine-tune the sensitivity of imbalance detection. The default value is `0.0`, with a step size of `0.1`.
- **Moving Average Settings (`maLength1`, `maLength2`, `maColor1`, `maColor2`)**:
- `maLength1` and `maLength2` define the lengths of the two moving averages used in the indicator. By default, they are set to `50` and `200` periods, respectively.
- `maColor1` and `maColor2` specify the colors of these moving averages on the chart. The first MA is colored blue, and the second is red.
- **Take Profit and Stop Loss Settings (`displayTP`, `tpMultiplier`, `tpColor`, `displaySL`, `slMultiplier`, `slColor`)**:
- `displayTP` and `displaySL` are boolean inputs that control whether the TP and SL areas are displayed on the chart.
- `tpMultiplier` and `slMultiplier` are multipliers used to calculate the TP and SL levels relative to the detected imbalance level using the ATR value.
- `tpColor` and `slColor` define the colors of these areas. The TP area is green (with a transparency of 50), and the SL area is red (with a transparency of 50).
- **Trailing Stop Settings (`trailMultiplier`)**: This setting determines the multiplier used to calculate the trailing stop level based on the ATR value. The default multiplier is `2.5`.
- **Style Settings (`bullishColor`, `bearishColor`)**:
- `bullishColor` and `bearishColor` set the colors for bullish and bearish zones created when an imbalance is detected. The bullish zone is green, and the bearish zone is red.
- **Signal Label Size (`labelSizeOption`)**: The size of the signal labels displayed on the chart can be adjusted. The options include `Tiny`, `Small`, `Normal`, `Large`, and `Huge`. The selected size affects the visual prominence of the labels.
#### 2. **ATR Calculation (`atrValue`)**
- The ATR value is calculated using a period of 14, which is a standard setting for measuring market volatility. This value is used extensively throughout the indicator to calculate TP, SL, and trailing stop levels.
#### 3. **Imbalance Detection and Zone Creation**
- The indicator detects potential imbalances in the market by comparing certain price points, using a custom function (`imbalanceCondition`).
- **Bullish Imbalance Detection (`bullishSignal`)**:
- A bullish imbalance is detected when the low of three bars ago is higher than the high of one bar ago, and the current close is above the low of three bars ago.
- Additional conditions include checking that the current close is above the calculated average of the two moving averages (`ma1` and `ma2`), and that the imbalance exceeds the threshold set by the `imbalanceFilter`.
- **Bearish Imbalance Detection (`bearishSignal`)**:
- A bearish imbalance is detected under conditions where the low of one bar ago is higher than the high of three bars ago, and the current close is below the high of three bars ago.
- Like the bullish signal, the close must also be below the average of the two moving averages, and the imbalance must exceed the `imbalanceFilter` threshold.
- Upon detection of an imbalance (either bullish or bearish), the indicator creates a zone using `box.new` that highlights the price range of the imbalance. The box color corresponds to the bullish or bearish nature of the signal.
- The center of the imbalance range is marked with a dashed line, and a corresponding label (`🔴` for bearish and `🟢` for bullish) is placed on the chart to indicate the detected signal.
#### 4. **Take Profit and Stop Loss Calculation (`calculateTPSL`)**
- When an imbalance is detected, the indicator calculates potential TP and SL levels based on the ATR value and the respective multipliers.
- If the TP or SL areas are enabled, the indicator plots these areas as colored boxes on the chart.
- The function also tracks whether these levels are hit by subsequent price action, updating the status (`reached`) as appropriate.
#### 5. **Trailing Stop Logic (`applyTrailingStop`)**
- The trailing stop feature is a dynamic mechanism that adjusts the stop level as the price moves in the trader's favor.
- The trailing stop is calculated using the ATR value multiplied by the `trailMultiplier`.
- If the trailing stop is triggered (i.e., the price crosses the trailing stop level), the indicator marks the trade as stopped out.
#### 6. **Plotting and Visualization**
- The indicator plots the two moving averages on the chart with the specified colors and line width.
- If a trailing stop is active, it plots the trailing stop level on the chart, updating as the stop moves.
- The bar color changes based on the status of the current signal and whether the trailing stop or TP/SL levels have been hit.
### **Detailed Execution Flow**
1. **Initialization**: The indicator initializes several variables, including lines, boxes, and the current signal state. This setup ensures that the script can dynamically update these elements as new price data comes in.
2. **Moving Average Calculation**: The moving averages (`ma1` and `ma2`) are calculated using simple moving average (SMA) functions, which are foundational for many of the indicator's conditions.
3. **Imbalance Detection**: The script evaluates price action to detect potential bullish or bearish imbalances, applying filters based on the user-defined `imbalanceFilter`.
4. **Zone Creation and Labeling**: Upon detecting an imbalance, the script creates visual zones on the chart using the `box.new` function and labels the zones for easy identification.
5. **Take Profit and Stop Loss Logic**: The TP and SL areas are calculated and plotted if the relevant settings are enabled. The script continuously checks if these levels are reached as new bars form.
6. **Trailing Stop Calculation**: The script dynamically adjusts the trailing stop level based on the price movement and ATR value. The trailing stop helps lock in profits as the trade progresses.
7. **Plotting**: The moving averages, trailing stop levels, and bar colors are plotted on the chart, providing a visual representation of the indicator's signals and trade management levels.
8. **Final Checks and Updates**: The script concludes each bar's processing by updating the status of various elements, such as whether levels have been reached or if the trailing stop has been triggered.
### **Conclusion**
The "Uptrick: Imbalance MA Trailing System" is a highly versatile indicator designed for traders who want to identify market imbalances and manage their trades effectively using a combination of moving averages, ATR-based calculations, and custom logic. The indicator offers a wide range of customization options, allowing traders to adjust the sensitivity of imbalance detection, the size of the signal labels, and the visibility of various trade management levels (TP, SL, and trailing stop).
The combination of these features makes it a powerful tool for both novice and experienced traders, providing clear visual cues and robust trade management capabilities directly on the chart.

Position Size CalculatorThe Position Size Calculator (PSC) is a comprehensive tool designed to assist traders in managing their trades risk by accurately calculating the optimal position size based on account settings, trade levels, and risk management parameters. This indicator helps traders make informed decisions by providing critical information about potential profit and loss , risk-reward ratio (RRR) , and position size (PS) .
█ Key Features
• Customizable Account Settings: Define your account size , currency , risk tolerance , and commission structure to personalize the calculations.
• Real-Time Trade Levels: Easily input your entry , stop loss , and take profit prices directly on the chart for immediate calculations.
• Visual Indicators: Clearly see your entry, stop loss, and take profit levels with customizable colors and labels.
• Comprehensive Position Information: View detailed information about your position, including potential profit and loss , risk-reward ratio , and position size .
• Currency Conversion: Automatically convert prices to your account currency, making it easy to manage trades in different markets.
• Hide Metrics : Choose which metrics to display to avoid emotional influence on your trading decisions (e.g., hiding PnL).
█ Conclusion
The Position Size Calculator is an essential tool for traders looking to optimize their trading strategies and manage risk effectively . By providing detailed calculations and visual indicators, this tool helps you make informed decisions, improving your overall trading performance.
█ Important
• Ensure that your stop loss and take profit levels are correctly set relative to your entry price to avoid errors.
• The default commission setting considers both entry and exit commissions. Adjust accordingly if only one commission is applicable.
Consider using this tool to manage every trade risk correctly and prevent significant drawdowns.
Hope you like it. Happy trading!

ICT KillZones + Pivot Points [TradingFinder] Support/Resistance 🟣 Introduction
Pivot Points are critical levels on a price chart where trading activity is notably high. These points are derived from the prior day's price data and serve as key reference markers for traders' decision-making processes.
Types of Pivot Points :
Floor
Woodie
Camarilla
Fibonacci
🔵 Floor Pivot Points
Widely utilized in technical analysis, floor pivot points are essential in identifying support and resistance levels. The central pivot point (PP) acts as the primary level, suggesting the trend's likely direction.
The additional resistance levels (R1, R2, R3) and support levels (S1, S2, S3) offer further insight into potential trend reversals or continuations.
🔵 Camarilla Pivot Points
Featuring eight distinct levels, Camarilla pivot points closely correspond with support and resistance, making them highly effective for setting stop-loss orders and profit targets.
🔵 Woodie Pivot Points
Similar to floor pivot points, Woodie pivot points differ by placing greater emphasis on the closing price, often resulting in different pivot levels compared to the floor method.
🔵 Fibonacci Pivot Points
Fibonacci pivot points combine the standard floor pivot points with Fibonacci retracement levels applied to the previous trading period's range. Common retracement levels used are 38.2%, 61.8%, and 100%.
🟣 Sessions
Financial markets are divided into specific time segments, known as sessions, each with unique characteristics and activity levels. These sessions are active at different times throughout the day.
The primary sessions in financial markets include :
Asian Session
European Session
New York Session
The timing of these major sessions in UTC is as follows :
Asian Session: 23:00 to 06:00
European Session: 07:00 to 14:25
New York Session: 14:30 to 22:55
🟣 Kill Zones
Kill zones are periods within a session marked by heightened trading activity. During these times, trading volume surges and price movements become more pronounced.
The timing of the major kill zones in UTC is :
Asian Kill Zone: 23:00 to 03:55
European Kill Zone: 07:00 to 09:55
New York Kill Zone: 14:30 to 16:55
Combining kill zones and pivot points in financial market analysis provides several advantages :
Enhanced Market Sentiment Analysis : Aligns key price levels with high-activity periods for a clearer market sentiment.
Improved Timing for Trade Entries and Exits : Helps better time trades based on when price movements are most likely.
Higher Probability of Successful Trades : Increases the accuracy of predicting market movements and placing profitable trades.
Strategic Stop-Loss and Profit Target Placement : Allows for precise risk management by strategically setting stop-loss and profit targets.
Versatility Across Different Time Frames : Effective in both short and long time frames, suitable for various trading strategies.
Enhanced Trend Identification and Confirmation : Confirms trends using both pivot levels and high-activity periods, ensuring stronger trend validation.
In essence, this integrated approach enhances decision-making, optimizes trading performance, and improves risk management.
🟣 How to Use
🔵 Two Approaches to Trading Pivot Points
There are two main strategies for trading pivot points: utilizing "pivot point breakouts" and "price reversals."
🔵 Pivot Point Breakout
When the price breaks through pivot lines, it signals a shift in market sentiment to the trader. In the case of an upward breakout, where the price crosses these pivot lines, a trader might enter a long position, placing their stop-loss just below the pivot point (P).
Conversely, if the price breaks downward, a short position can be initiated below the pivot point. When using the pivot point breakout strategy, the first and second support levels can serve as profit targets in an upward trend. In a downward trend, these roles are filled by the first and second resistance levels.
🔵 Price Reversal
An alternative method involves waiting for the price to reverse at the support and resistance levels. To implement this strategy, traders should take positions opposite to the prevailing trend as the price rebounds from the pivot point.
While this tool is commonly used in higher time frames, it tends to produce better results in shorter time frames, such as 1-hour, 30-minute, and 15-minute intervals.
Three Strategies for Trading the Kill Zone
There are three principal strategies for trading within the kill zone :
Kill Zone Hunt
Breakout and Pullback to Kill Zone
Trading in the Trend of the Kill Zone
🔵 Kill Zone Hunt
This strategy involves waiting until the kill zone concludes and its high and low lines are established. If the price reaches one of these lines within the same session and is strongly rejected, a trade can be executed.
🔵 Breakout and Pullback to Kill Zone
In this approach, once the kill zone ends and its high and low lines stabilize, a trade can be made if the price breaks one of these lines decisively within the same session and then pulls back to that level.
🔵 Trading in the Trend of the Kill Zone
Kill zones are characterized by high trading volumes and strong trends. Therefore, trades can be placed in the direction of the prevailing trend. For instance, if an upward trend dominates this area, a buy trade can be entered when the price reaches a demand order block.

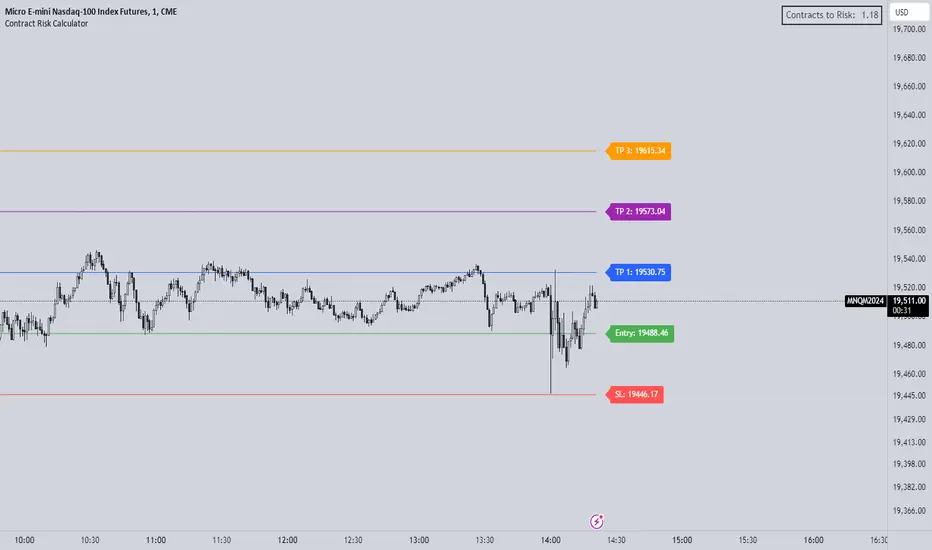
Futures Risk CalculatorThe "Futures Risk Calculator" is designed to assist traders in calculating the number of contracts to risk based on their account size, risk percentage, and stop loss level. This script provides a convenient way for traders to determine their position size in futures or other instruments where contracts are used.
The script prompts users to input their account size, risk percentage, entry price, and stop loss price. It then calculates the stop size in points, risk in dollars, and the number of contracts to risk. These calculations are based on standard risk management principles commonly used in trading.
The script plots the entry and stop loss lines on the chart for visual reference. Additionally, it displays a label in the top-right corner of the chart, showing the calculated number of contracts to risk. The label updates dynamically as the input values or market conditions change.
Originality and Usefulness:
This script is original and adds value to the TradingView community by providing traders with a practical tool for managing risk in their trading strategies. It is focusing on risk management, an essential aspect of successful trading.
By automating the calculation process, the script saves traders time and reduces the potential for manual errors. It encourages traders to adopt disciplined risk management practices, which are crucial for long-term profitability and capital preservation.
How to Use:
Input your account size, risk percentage, entry price, and stop loss price in the script settings.
Enter the pip size according to the instrument you are using (by default its's based for NASDAQ)
The script will automatically calculate the number of contracts to risk based on the provided inputs.
The entry and stop loss lines will be plotted on the chart for visual reference.
The calculated number of contracts to risk will be displayed in the top-right corner of the chart.
By following these steps, traders can effectively manage their risk exposure and make informed decisions when entering trades.
Evolving RThe "Evolving R" script is a script that allows to calculate a dynamic reward-to-risk ratio at any given point of time during the trade. Its fundamentals are based on Tom Dante's concept of an evolving reward-to-risk. The script requires a user to input their preferred stop loss price and the target price for a specific asset, and calculates the ratio between two differences: (a) the absolute difference between the target price and the current price and (b) the absolute difference between the stop loss price and the current price.
The output of the script displays the ratio discussed as a value called "Evolving R" in the table. In order to use it successfully, the user of the script has to input:
(a) Stop loss price for the asset
(b) Target price for the asset
Theoretically, as long as the evolving R value holds above or equal to 0.25, the trade is worth holding. However, if the evolving R value drops below 0.25, the table turns red and signifies that such a trade possesses more risk than there is a reward remaining: this alerts the user to possibly take profits prematurely without risking their unrealized gains for a minor amount of additional gain.
The graphics of the script are represented by green and red areas: the green area indicates the area between the current price and the target price, while the red area shows the distance between the current price and the stop loss price. This visual representation allows users to understand the relative reward-to-risk ratio graphically in addition to the given evolving R value output.
The script is used for any type of trading: whether trend-trading or in a ranging market, it doesn't suggest a user which market conditions they should use.

ICT Unicorn Model [LuxAlgo]The ICT Unicorn Model indicator highlights the presence of "unicorn" patterns on the user's chart which is derived from the lectures of "The Inner Circle Trader" (ICT) .
Detected patterns are followed by targets with a distance controlled by the user.
🔶 USAGE
At its core, the ICT Unicorn Model relies on two popular concepts, Fair Value Gaps and Breaker Blocks. This combination highlights a future area of support/resistance.
A Bullish Unicorn Pattern consists out of:
A Lower Low (LL), followed by a Higher High (HH)
A Fair Value Gap (FVG), overlapping the established Breaker Block
A successful re-test of the FVG which confirms the pattern.
A Bearish Unicorn Pattern consists of:
A Higher High (HH), followed by a Lower Low (LL)
A Fair Value Gap (FVG), overlapping the established Breaker Block
A successful re-test of the FVG which confirms the pattern
The pattern detection depends on detected swings, which can be controlled by the Swing setting. Using higher values of this setting will return longer-term breaker blocks.
🔹 Using Risk/Reward Targets
A confirmed Unicorn pattern will show a blue ( Target ) / grey ( Stop Loss) "Risk/Reward" areas (RR).
When the Stop Loss or Target is hit, a white line is shown on the concerned side.
The Risk/Reward ratio can be adjusted in the "Targets" settings.
🔹 Trailing Stop
As seen in the previous snapshots, besides the RR areas, this indicator also includes an optional Trailing Stop .
This can be helpful to lower your risk, by exiting earlier than if you would wait until the Stop Loss is hit.
This example shows a successful bullish and bearish Unicorn Pattern . In this scenario, the Trailing Stop could be used for partial Take Profit.
The goal of this publication is to show confirmed Unicorn Patterns . To increase the chance of success, it is important to evaluate the bigger picture & use this in confluence with your price action analysis. For example, look for potential areas of liquidity, consider this pattern only during certain market sessions, avoid trading during heavy impact news, &/or incorporate other aspects of technical analysis rather than just following this pattern blindly.
🔶 DETAILS
🔹 Combine
When disabled, all potential Unicorn Patterns will delete previous unconfirmed patterns:
Enabling Combine ensures the last Unicorn Patterns in the opposite direction will remain.
While the latter bullish pattern became invalid, another one formed.
The combination of the previous bearish pattern, and looking at the big picture, the bullish pattern did not have much chance to be successful.
While disabling 'combine' helps minimize clutter, enabling this feature can give a pattern more chance to hit the SL/Target level.
🔹 Mitigated FVG
Users can determine if a pattern becomes invalid due to a mitigated FVG, causing the pattern to be deleted.
🔹 New pattern detected
When a new pattern is detected, the previous unconfirmed pattern in the same direction (bullish - bullish or bearish - bearish) will be deleted. This will always be the case, whether "Combine' is enabled or disabled.
When the previous pattern was confirmed but no SL or Target level was hit, this pattern will stop updating.
🔶 SETTINGS
🔹 Unicorn
Swings: This sets the length of swings, used for the underlying ZigZag and Unicorn Patterns detection.
Bull: Enable/disable Bullish patterns, and set the color of FVG box and Trailing Stop .
Bear: Enable/disable Bearish patterns, and set the color of FVG box and Trailing Stop .
Combine: When enabled, patterns in opposite directions (bullish/bearish) can exist at the same time. disabling this feature tends to give less clutter. See the "Usage" section for more information.
🔹 Targets
Risk/Reward: Sets the Risk/Reward ratio.
Trailing Stop: Set the length of small swings, which is used for the Trailing Stop .

[imba]lance algo🟩 INTRODUCTION
Hello, everyone!
Please take the time to review this description and source code to utilize this script to its fullest potential.
🟩 CONCEPTS
This is a trend indicator. The trend is the 0.5 fibonacci level for a certain period of time.
A trend change occurs when at least one candle closes above the level of 0.236 (for long) or below 0.786 (for short). Also it has massive amout of settings and features more about this below.
With good settings, the indicator works great on any market and any time frame!
A distinctive feature of this indicator is its backtest panel. With which you can dynamically view the results of setting up a strategy such as profit, what the deposit size is, etc.
Please note that the profit is indicated as a percentage of the initial deposit. It is also worth considering that all profit calculations are based on the risk % setting.
🟩 FEATURES
First, I want to show you what you see on the chart. And I’ll show you everything closer and in more detail.
1. Position
2. Statistic panel
3. Backtest panel
Indicator settings:
Let's go in order:
1. Strategies
This setting is responsible for loading saved strategies. There are only two preset settings, MANUAL and UNIVERSAL. If you choose any strategy other than MANUAL, then changing the settings for take profits, stop loss, sensitivity will not bring any results.
You can also save your customized strategies, this is discussed in a separate paragraph “🟩HOW TO SAVE A STRATEGY”
2. Sensitive
Responsible for the time period in bars to create Fibonacci levels
3. Start calculating date
This is the time to start backtesting strategies
4. Position group
Show checkbox - is responsible for displaying positions
Fill checkbox - is responsible for filling positions with background
Risk % - is responsible for what percentage of the deposit you are willing to lose if there is a stop loss
BE target - here you can choose when you reach which take profit you need to move your stop loss to breakeven
Initial deposit- starting deposit for profit calculation
5. Stoploss group
Fixed stoploss % checkbox - If choosed: stoploss will be calculated manually depending on the setting below( formula: entry_price * (1 - stoploss percent)) If NOT choosed: stoploss will be ( formula: fibonacci level(0.786/0.236) * (1 + stoploss percent))
6. Take profit group
This group of settings is responsible for how far from the entry point take profits will be and what % of the position to fix
7. RSI
Responsible for configuring the built-in RSI. Suitable bars will be highlighted with crosses above or below, depending on overbought/oversold
8. Infopanels group
Here I think everything is clear, you can hide or show information panels
9. Developer mode
If enabled, all events that occur will be shown, for example, reaching a take profit or stop loss with detailed information about the unfixed balance of the position
🟩 HOW TO USE
Very simple. All you need is to wait for the trend to change to long or short, you will immediately see a stop loss and four take profits, and you will also see prices. Like in this picture:
🟩 ALERTS
There are 3 types of alerts:
1. Long signal
2. Short signal
3. Any alert() function call - will be send to you json with these fields
{
"side": "LONG",
"entry": "64.454",
"tp1": "65.099",
"tp2": "65.743",
"tp3": "66.388",
"tp4": "67.032",
"winrate": "35.42%",
"strategy": "MANUAL",
"beTargetTrigger": "1",
"stop": "64.44"
}
🟩 HOW TO SAVE A STRATEGY
First, you need to make sure that the “MANUAL” strategy is selected in the strategy settings.
After this, you can start selecting parameters that will show the largest profit in the statistics panel.
I have highlighted what you need to pay attention to when choosing a strategy
Let's assume you have set up a strategy. The main question is how to preserve it?
Let’s say the strategy turned out with the following parameters:
Next we need to find this section of code:
// STRATS
selector(string strategy_name) =>
strategy_settings = Strategy_settings.new()
switch strategy_name
"MANUAL" =>
strategy_settings.sensitivity := 18
strategy_settings.risk_percent := 1
strategy_settings.break_even_target := "1"
strategy_settings.tp1_percent := 1
strategy_settings.tp1_percent_fix := 40
strategy_settings.tp2_percent := 2
strategy_settings.tp2_percent_fix := 30
strategy_settings.tp3_percent := 3
strategy_settings.tp3_percent_fix := 20
strategy_settings.tp4_percent := 4
strategy_settings.tp4_percent_fix := 10
strategy_settings.fixed_stop := false
strategy_settings.sl_percent := 0.0
"UNIVERSAL" =>
strategy_settings.sensitivity := 20
strategy_settings.risk_percent := 1
strategy_settings.break_even_target := "1"
strategy_settings.tp1_percent := 1
strategy_settings.tp1_percent_fix := 40
strategy_settings.tp2_percent := 2
strategy_settings.tp2_percent_fix := 30
strategy_settings.tp3_percent := 3
strategy_settings.tp3_percent_fix := 20
strategy_settings.tp4_percent := 4
strategy_settings.tp4_percent_fix := 10
strategy_settings.fixed_stop := false
strategy_settings.sl_percent := 0.0
// "NEW STRATEGY" =>
// strategy_settings.sensitivity := 20
// strategy_settings.risk_percent := 1
// strategy_settings.break_even_target := "1"
// strategy_settings.tp1_percent := 1
// strategy_settings.tp1_percent_fix := 40
// strategy_settings.tp2_percent := 2
// strategy_settings.tp2_percent_fix := 30
// strategy_settings.tp3_percent := 3
// strategy_settings.tp3_percent_fix := 20
// strategy_settings.tp4_percent := 4
// strategy_settings.tp4_percent_fix := 10
// strategy_settings.fixed_stop := false
// strategy_settings.sl_percent := 0.0
strategy_settings
// STRATS
Let's uncomment on the latest strategy called "NEW STRATEGY" rename it to "SOL 5m" and change the sensitivity:
// STRATS
selector(string strategy_name) =>
strategy_settings = Strategy_settings.new()
switch strategy_name
"MANUAL" =>
strategy_settings.sensitivity := 18
strategy_settings.risk_percent := 1
strategy_settings.break_even_target := "1"
strategy_settings.tp1_percent := 1
strategy_settings.tp1_percent_fix := 40
strategy_settings.tp2_percent := 2
strategy_settings.tp2_percent_fix := 30
strategy_settings.tp3_percent := 3
strategy_settings.tp3_percent_fix := 20
strategy_settings.tp4_percent := 4
strategy_settings.tp4_percent_fix := 10
strategy_settings.fixed_stop := false
strategy_settings.sl_percent := 0.0
"UNIVERSAL" =>
strategy_settings.sensitivity := 20
strategy_settings.risk_percent := 1
strategy_settings.break_even_target := "1"
strategy_settings.tp1_percent := 1
strategy_settings.tp1_percent_fix := 40
strategy_settings.tp2_percent := 2
strategy_settings.tp2_percent_fix := 30
strategy_settings.tp3_percent := 3
strategy_settings.tp3_percent_fix := 20
strategy_settings.tp4_percent := 4
strategy_settings.tp4_percent_fix := 10
strategy_settings.fixed_stop := false
strategy_settings.sl_percent := 0.0
"SOL 5m" =>
strategy_settings.sensitivity := 15
strategy_settings.risk_percent := 1
strategy_settings.break_even_target := "1"
strategy_settings.tp1_percent := 1
strategy_settings.tp1_percent_fix := 40
strategy_settings.tp2_percent := 2
strategy_settings.tp2_percent_fix := 30
strategy_settings.tp3_percent := 3
strategy_settings.tp3_percent_fix := 20
strategy_settings.tp4_percent := 4
strategy_settings.tp4_percent_fix := 10
strategy_settings.fixed_stop := false
strategy_settings.sl_percent := 0.0
strategy_settings
// STRATS
Now let's find this code:
strategy_input = input.string(title = "STRATEGY", options = , defval = "MANUAL", tooltip = "EN:\nTo manually configure the strategy, select MANUAL otherwise, changing the settings won't have any effect\nRU:\nЧтобы настроить стратегию вручную, выберите MANUAL в противном случае изменение настроек не будет иметь никакого эффекта")
And let's add our new strategy there, it turned out like this:
strategy_input = input.string(title = "STRATEGY", options = , defval = "MANUAL", tooltip = "EN:\nTo manually configure the strategy, select MANUAL otherwise, changing the settings won't have any effect\nRU:\nЧтобы настроить стратегию вручную, выберите MANUAL в противном случае изменение настроек не будет иметь никакого эффекта")
That's all. Our new strategy is now saved! It's simple! Now we can select it in the list of strategies:

Anchored Chandelier ExitThe Chandelier Exit is a popular tool among traders used to help determine appropriate stop loss levels. Originally developed by Chuck LeBeau, the Chandelier Exit takes into account market volatility and adjusts the stop loss level dynamically. This indicator builds upon the original Chandelier Exit by allowing the trader to select an anchor date or starting point for the indicator to begin calculating from.
The Original Chandelier Exit
Before we get into the details of the Anchored Chandelier Exit, let's review the original. Essentially a dynamic ATR stop loss, the Chandelier Exit provides a trailing stop that moves higher or lower based on volatility.
The Chandelier Exit is calculated based on the following criteria:
🔶ATR - The ATR is used to measure the volatility of a security over a lookback period. The ATR length determines the number of bars to consider when calculating the average true range. The shorter the length, the more responsive the level will be.
🔶ATR Multiplier - The default multiplier is set to 3. This is used to determine the sensitivity of the Chandelier Exit. The higher the ATR multiplier the wider the stop levels will be. A lower multiplier will tighten stop levels.
🔶Highest / Lowest Points - Determine the highest high (bullish trade) or lowest low (bearish trade) during the lookback period. The default length is 22 bars.
Calculating the Chandelier Exit
Bullish trades - Highest High - ATR * Multiplier
Bearish trades - Lowest Low + ATR * Multiplier
The Anchored Chandelier Exit
The Anchored Chandelier Exit is a new twist on the original, allowing traders to adapt their stop loss levels based on specific market events, levels or bars.
Similar to the original, traders can select the ATR length and multiplier, however, the high or low from which the ATR is subtracted or added is first determined at the anchor bar.
As new bars form, the indicator checks for the previous high/low to be breached. If the high or low is exceeded, the highest/lowest point is updated and the Chandelier Exit is recalculated.
When the indicator is first loaded to your chart, it will ask you to select an anchor bar and choose the bias for the trade.
A bullish (long) bias trade will plot the Chandelier Exit below price action, while a bearish (short) bias trade will plot the Chandelier Exit above price action.
Indicator Features
🔶Custom Start Date
🔶Bullish or Bearish Bias
🔶Selectable ATR Length & Multiplier
🔶Custom Colors
🔶Exit With Close or Wicks
🔶Exit Alerts
With careful parameter optimization, the Anchored Chandelier Exit can be a useful tool for helping traders manage risk based on market volatility.

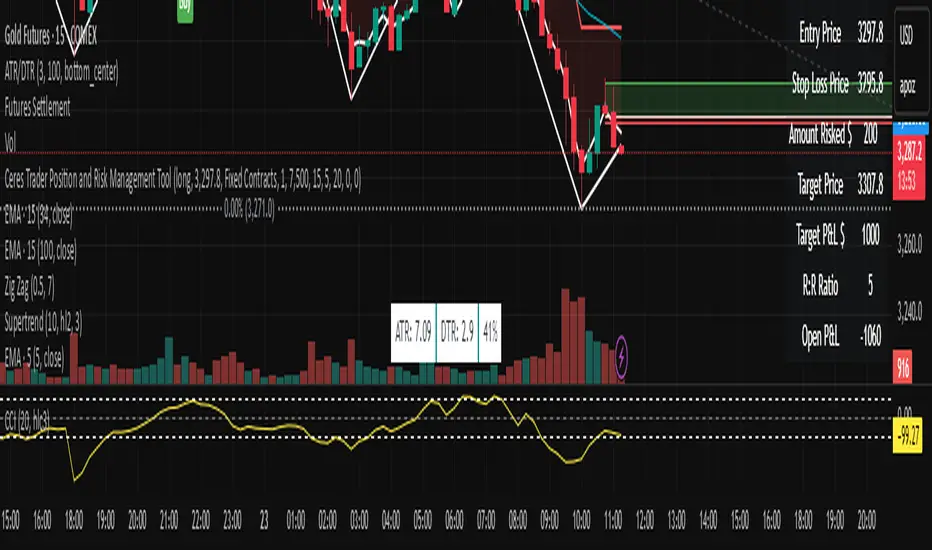
Ceres Trader Position and Risk Management ToolNOTE: It won't properly scale until you enter an entry point that is located on the chart. It's a feature not a bug. After that, you will see the entry, s/l, and target price lines properly displayed on the chart.
The "Ceres Trader Position and Risk Management Tool" is a comprehensive indicator designed for TradingView, meticulously crafted for traders who prioritize effective risk management and clear position visualization. This tool seamlessly integrates with your trading strategy, providing crucial information about your trades directly on your chart.
Key Features:
Position Type Visualization: Displays long or short positions with distinct color-coded lines and boxes for easy recognition.
Entry, Stop Loss, and Target Levels: Visual markers for entry price, stop loss, and target price, enabling you to track your trade setup at a glance.
Risk Assessment: Calculates and displays the amount at risk based on the stop loss distance and the percentage of risk capital.
Profit Potential: Shows the potential profit in dollar terms if the target is reached, helping you understand the reward prospects of your trade.
Reward to Risk Ratio: Indicates the ratio of potential reward to risk, an essential metric for evaluating the efficiency of your trade setup.
Current P&L Tracking: Continuously updates the open profit and loss based on the current market price, giving you real-time insight into your trade's performance.
Customizable Risk and Reward Boxes: Allows personalization of the risk and reward zones with color options, enhancing chart clarity and visual appeal.
How to Use:
Setting Up Your Trade:
Input your trade details including position type (long or short), entry price, risk capital, risk percentage, reward-risk ratio, and stop loss distance.
Visualize Your Trade:
The tool will automatically plot the entry, stop loss, and target prices on the chart.
Risk and reward areas will be highlighted with customizable color boxes.
Monitor Your Risk and Reward:
View the amount risked and potential profit in dollar terms directly on the chart.
Keep track of the reward to risk ratio to assess trade efficiency.
Stay Informed of Real-time Performance:
The current P&L of your open position will be updated in real-time, helping you make informed decisions.
This tool is ideal for traders who follow disciplined risk management practices and want to keep essential trade information easily accessible. With the "Ceres Trader Position and Risk Management Tool," you are equipped to make strategic trading decisions backed by clear visual cues and critical data.
Breakout/Breakdown Indicator (30 Min Range) by InvestYourAsset👉The indicator provided here is a technical analysis indicator for TradingView users that identifies potential breakout and breakdown opportunities on the initial 30-minute range in every trading session.
👉The indicator high and low of the initial 30-minute period and plotting them as horizontal lines on the chart. The high is marked in green line and the low is marked in red line.
📈The indicator then generates buy and sell signals based on whether the current close price crosses above or below the previous 30-minute high and low, respectively.
📢The indicator also has two inputs:
👉 sessionStartHour : The hour at which the trading session begins. The default value is 9, However users can change the time according to their own trading style.
👉 sessionStartMinute : The minute at which the trading session begins. The default value is 0.
These inputs can be used to adjust the indicator to the specific trading session that you are interested in.
✅How to use the Indicator:
👉To use the 30 Minute Breakout/Breakdown Indicator, simply add it to your chart and configure the inputs to your liking. Once the indicator is added to the chart, it will plot the 30-minute high and low as horizontal lines, as well as generate buy and sell signals based on the current close price.
✅Here is a step-by-step guide:
📈Open TradingView and select the chart that you want to add the indicator to.
📈Click on the "Indicators" tab and search for "30 Minute Breakout/Breakdown Indicator by InvestYourAsset".
📈Click on the indicator to add it to your chart.
📈Configure the inputs to your liking. The default values are typically fine, but you can experiment with different values to see what works best for you.
📈Once you are satisfied with the settings, click on the "Apply" button.
📈The indicator will now be displayed on your chart. You will see two horizontal lines representing the previous 30-minute high and low, as well as triangles representing buy and sell signals.
✅How to interpret the signals:
📈Buy signal : A buy signal is generated when the current close price crosses above the previous 30-minute high. This suggests that the price is likely to continue moving higher in the short term.
📈Sell signal : A sell signal is generated when the current close price crosses below the previous 30-minute low. This suggests that the price is likely to continue moving lower in the short term.
👉Traders should remember that the present indicator is just one tool that can be used to identify potential trading opportunities. It is important to use other technical analysis tools and risk management techniques to confirm your trading signals before entering any trades.
✅Things to consider while using the indicator:
📈Look for buy signals in an uptrend and sell signals in a downtrend. This will increase the likelihood of your trades being successful.
📈Place your stop losses below the previous 30-minute low for buy signals and above the previous 30-minute high for sell signals. This will help to limit your losses if the trade goes against you.
📈Consider taking profits at key resistance and support levels. This will help you to lock in your profits and avoid giving them back to the market.
Follow us for timely updates regarding indicators that we may publish in future and give it a like if you appreciate the indicator.

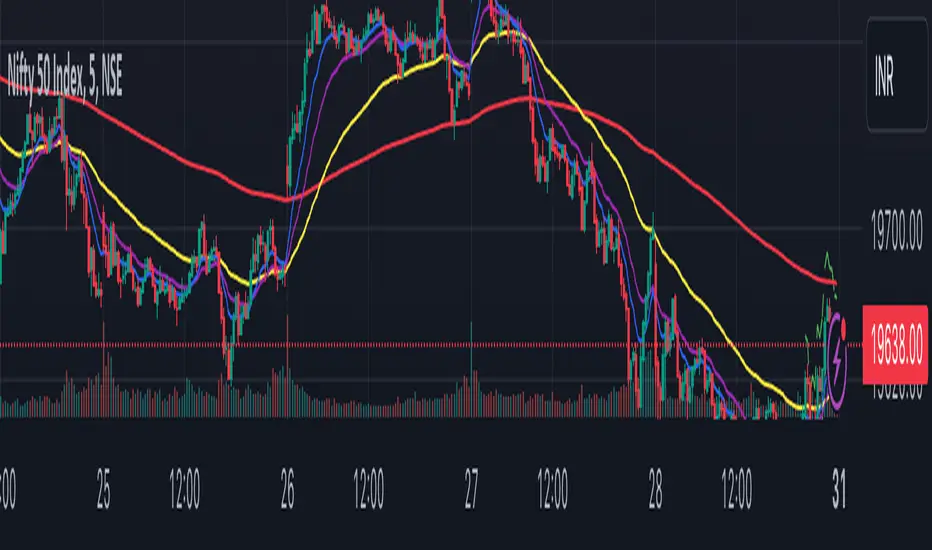
Tribute to David PaulI made this indicator as a tribute to the late David Paul .
He mentioned quite a lot about 89 periods moving average (especially on 4h), also the 21 and 55.
I put up some entries when three ma are crossed by price in the same direction, bull/bear backgrounds and a color code for candles because who doesn't love the feeling of a lasting trend.
To be more specific :
The indicator plots sma21, sma55, sma89 and AMA = (sma21+sma55+sma89)/3
When the closing price crosses the highest of the 3 sma, it is considered a bullish confirmation.
At this moment two lines appear, one on the bottom of the candle that crossed, one on the crossing point.
The lowest line can be used as the stop loss value of a long.
The highest line can be used as an entry point for a long.
When the closing price crosses the lowest of the 3 sma, it is considered a bearish confirmation.
At this moment two lines appear, one on the top of the candle that crossed, one on the crossing point.
The highest line can be used as the stop loss value of a short.
The lowest line can be used as an entry point for shorts.
When the closing price is above AMA, it is considered a bullish confirmation.
At this time a blue background appears at the crossing point.
The highest line can be used as the stop loss value for a long.
The starting point of the background can be used as the entry point for a long.
When the closing price is below AMA, it is considered a bearish confirmation.
At this time a red background appears at the crossing point.
The highest line can be used as the stop loss value for a short.
The starting point of the background can be used as the entry point for a short.
When the price is above 3 sma the candles turn blue. Signifying an upward trend.
When the price is below 3 sma the candles turn red. Signifying a bearish trend.
When the price is neither simultaneously above nor below the 3 sma, the candles are gray and the background linked to AMA becomes less vivid. Meaning a loss of vitality of the current trend or an absence of a clear trend.
Ideally, you should take a position towards "Real Long/Short Entry", set your stop loss towards "Ideal Long/Short Entry", and close the trade either when the background ends (riskier but more potential), or when the candles become gray (more conservative but noisier).
In the inputs, you can modify the display rules (explained in the tooltips), by default everything is displayed.

Smoothing ATR bandThere are two bands calculated with the ATR and I added "Smoothing" into the script.
Smoothing ATR with multiplier can display two bands above and below the price.
We can ONLY find some ATR bands in Community Scripts with "Basic" setting which is used to set Stop Loss.
And yet , Smoothing ATR with multiplier is capable of making traders manifestly recognize OverBought & OverSold.
FurtherMore, I added a condition with "plotshape", which is "Stop Hunt"
Stop Hunt is an absolutely usual strategy to clean the leverage and it always makes high volatility moves.
When high> above band and close< above band , long signal, it means it had been abundantly bought but the larger traders weren't satisfied; therefore, they quickly sold out to lower the price. The sell condition is on the contrary.
The signals mainly make traders manifestly recognize OverBought & OverSold.

Bar Color Long / Short Indicator With Advised SL Rev 1This is the Revised Version of Bar Color Long / Short Indicator With Advised SL with some extra features
Overview
This script is a trading indicator named "Bar Color Long / Short Indicator With Advised SL" designed for the TradingView platform. The indicator's primary purpose is to provide entry signals for long and short positions, based on various technical analysis methods. Additionally, the indicator suggests stop-loss levels for both long and short positions.
User Inputs
The indicator has several user inputs, such as:
Length
Smoothing
Multiplier
Show bar colors (ON/OFF)
When the bar colors are turned off, the alert signals for long and short positions will be displayed instead.
Custom Risk Calculation
The script calculates a custom risk level based on a modified version of the RSI (Relative Strength Index) formula. The custom risk level is divided into three categories: low, medium, and high.
Sentiment Score Calculation
The indicator calculates a sentiment score based on a combination of methods resembling EMA (Exponential Moving Average), MACD (Moving Average Convergence Divergence), and ROC (Rate of Change). The sentiment score is used to determine if the sentiment is positive or negative.
Bollinger Bands Percent and Combined Signal
The Bollinger Bands Percent is calculated, and the custom risk, sentiment score, and Bollinger Bands Percent are combined to generate a new signal. This signal is used in conjunction with EMA10 to determine the bar colors and provide entry signals.
Bar Colors
Based on the combined signal and EMA10, the script determines the bar colors as follows:
Orange: Positive sentiment
Blue: Negative sentiment
Gray: Neutral
Entry Signals and Alerts
When the bar colors are turned off, the indicator displays large green arrow signals for long (buy) positions and red arrow signals for short (sell) positions based on the sentiment and EMA10 conditions. The script also includes alert conditions for long and short signals, which can be used to set up notifications when these signals are triggered in the TradingView platform.
Advised Stop-Loss Levels
The indicator plots stop-loss lines for both long and short positions at the last candle, accompanied by labels showing the advised stop-loss levels in numeric values
Rev 1
added / changed :
SMA50 slope check
EMA20 higher or lower than EMA10
color ON/OFF changed
Signal once Buy and Sell
Trend Analyser by Abdul KhaderThis indicator is designed to provide buy and sell signals based on a combination of technical analysis methods. It uses the Relative Strength Index (RSI), Moving Average Convergence Divergence (MACD), and Exponential Moving Averages (EMA) to generate signals. It also calculates Stop Loss (SL) and Take Profit (TP) levels based on the Average True Range (ATR).
Components:
RSI: An oscillator that measures the speed and change of price movements. RSI is used to identify overbought and oversold conditions. In this indicator, an RSI below 30 is considered oversold and an RSI above 70 is considered overbought.
MACD: A trend-following momentum indicator that shows the relationship between two moving averages of a security’s price. The MACD triggers technical signals when it crosses above (to buy) or below (to sell) its signal line.
EMA: These moving averages give more weight to recent prices and are used to identify short-term price trends. A crossover of a shorter period EMA (9 periods in this case) above a longer period EMA (21 periods in this case) generates a buy signal. Conversely, a crossover of the shorter EMA below the longer EMA generates a sell signal.
ATR: This is a market volatility indicator. The ATR is used to calculate Stop Loss and Take Profit levels. These levels are set at a distance from the entry price, equal to a certain multiplier (1.5 in this case) of the ATR.
How to Use:
Buy Signal: A green triangle below the price bar indicates a buy signal. This is generated when the following conditions are met:
The short-term EMA crosses above the long-term EMA
The RSI is below 30 (oversold condition)
The MACD line crosses above the signal line and is above zero
Sell Signal: A red triangle above the price bar indicates a sell signal. This is generated when the following conditions are met:
The short-term EMA crosses below the long-term EMA
The RSI is above 70 (overbought condition)
The MACD line crosses below the signal line and is below zero
Stop Loss and Take Profit: These levels are indicated by dashed lines. The stop loss for a long position is set below the entry price, while the take profit is set above. For a short position, the stop loss is set above the entry price and the take profit is set below.
Important Notes:
This indicator is designed for intraday trading and may not be suitable for longer-term trades.
Always use this indicator in conjunction with other aspects of technical and fundamental analysis. No indicator can provide accurate signals 100% of the time.
Always backtest this indicator with historical data before using it in live trading.
Risk management is crucial in trading. Never risk more than a small percentage of your trading capital on a single trade.
XAUUSD & XAGUSD LOT SIZE CALCUALTOR - BY ADRIANFX94This calculator is a tool designed for traders who trade on the financial markets with instruments like gold (XAUUSD) and silver (XAGUSD). It helps you determine the appropriate lot size to trade based on your account balance, desired risk percentage, and stop-loss size in pips.
Here's how it works:
Account Balance: You input your account balance in US dollars (USD). This is the amount of money you have available to trade.
Risk Percentage: You specify the percentage of your account balance that you are willing to risk on each trade. For example, if you set it to 1%, you are willing to risk 1% of your account balance on a single trade.
Stop Loss Pip Size: You set the size of your stop loss in pips. A stop loss is a risk management tool that defines the maximum amount you are willing to lose on a trade.
The calculator then uses this information along with contract sizes and pip sizes for gold and silver to calculate the appropriate lot size for each instrument. Lot size refers to the number of units or contracts you will trade.
The results are displayed in a table on the top-right corner of your trading chart. The table shows your account balance, the risk percentage you set, and the calculated lot size for gold and silver. The lot size represents the number of contracts you should trade for each instrument to align with your risk management strategy.
By using this calculator, traders can make informed decisions about their trade sizes, ensuring they manage their risk effectively and trade in a way that aligns with their account balance and risk tolerance. It helps traders avoid overexposing their accounts to risk and helps maintain a disciplined trading approach.
Average True Range Trailing Mean [Alifer]Upgrade of the Average True Range default indicator by TradingView. It adds and plots a trailing mean to show periods of increased volatility more clearly.
ATR TRAILING MEAN
A trailing mean, also known as a moving average, is a statistical calculation used to smooth out data over time and identify trends or patterns in a time series.
In our indicator, it clearly shows when the ATR value spikes outside of it's average range, making it easier to identify periods of increased volatility.
Here's how the ATR Trailing Mean (atr_mean) is calculated:
atr_mean = ta.cum(atr) / (bar_index + 1) * atr_mult
The ta.cum() function calculates the cumulative sum of the ATR over all bars up to the current bar.
(bar_index + 1) represents the number of bars processed up to the current bar, including the current one.
By dividing the cumulative ATR ta.cum(atr) by (bar_index + 1) and then multiplying it by atr_mult (Multiplier), we obtain the ATR Trailing Mean value.
If atr_mult is set to 1.0, the ATR Trailing Mean will be equal to the simple average of the ATR values, and it will follow the ATR's general trend.
However, if atr_mult is increased, the ATR Trailing Mean will react more strongly to the ATR's recent changes, making it more sensitive to short-term fluctuations.
On the other hand, reducing atr_mult will make the ATR Trailing Mean less responsive to recent changes in ATR, making it smoother and less prone to reacting to short-term volatility.
In summary, adjusting the atr_mult input allows traders to fine-tune the ATR Trailing Mean's responsiveness based on their preferred level of sensitivity to recent changes in market volatility.
IMPLEMENTATION IN A STRATEGY
You can easily implement this indicator in an existing strategy, to only enter positions when the ATR is above the ATR Trailing Mean (with Multiplier-adjusted sensitivity). To do so, add the following lines of codes.
Under Inputs:
length = input.int(title="Length", defval=20, minval=1)
atr_mult = input.float(defval=1.0, step = 0.1, title = "Multiplier", tooltip = "Adjust the sensitivity of the ATR Trailing Mean line.")
smoothing = input.string(title="Smoothing", defval="RMA", options= )
ma_function(source, length) =>
switch smoothing
"RMA" => ta.rma(source, length)
"SMA" => ta.sma(source, length)
"EMA" => ta.ema(source, length)
=> ta.wma(source, length)
This will allow you to define the Length of the ATR (lookback length over which the ATR is calculated), the Multiplier to adjust the Trailing Mean's sensitivity and the type of Smoothing to be used for the ATR.
Under Calculations:
atr= ma_function(ta.tr(true), length)
atr_mean = ta.cum(atr) / (bar_index+1) * atr_mult
This will calculate the ATR based on Length and Smoothing, and the resulting ATR Trailing Mean.
Under Entry Conditions, add the following to your existing conditions:
and atr > atr_mean
This will make it so that entries are only triggered when the ATR is above the ATR Trailing Mean (adjusted by the Multiplier value you defined earlier).
ATR - DEFINITION AND HISTORY
The Average True Range (ATR) is a technical indicator used to measure market volatility, regardless of the direction of the price. It was developed by J. Welles Wilder and introduced in his book "New Concepts in Technical Trading Systems" in 1978. ATR provides valuable insights into the degree of price movement or volatility experienced by a financial asset, such as a stock, currency pair, commodity, or cryptocurrency, over a specific period.
ATR - CALCULATION AND USAGE
The ATR calculation involves three components:
1 — True Range (TR): The True Range is a measure of the asset's price movement for a given period. It takes into account the following factors:
The difference between the high and low prices of the current period.
The absolute value of the difference between the high price of the current period and the closing price of the previous period.
The absolute value of the difference between the low price of the current period and the closing price of the previous period.
Mathematically, the True Range (TR) for the current period is calculated as follows:
TR = max(high - low, abs(high - previous_close), abs(low - previous_close))
2 — ATR Calculation: The ATR is calculated as a Moving Average (MA) of the True Range over a specified period.
The ATR is calculated as follows:
ATR = MA(TR, length)
3 — ATR Interpretation: The ATR value represents the average volatility of the asset over the chosen period. Higher ATR values indicate higher volatility, while lower ATR values suggest lower volatility.
Traders and investors can use ATR in various ways:
Setting Stop Loss and Take Profit Levels: ATR can help determine appropriate stop-loss and take-profit levels in trading strategies. A larger ATR value might require wider stop-loss levels to allow for the asset's natural price fluctuations, while a smaller ATR value might allow for tighter stop-loss levels.
Identifying Market Volatility: A sharp increase in ATR might indicate heightened market uncertainty or the potential for significant price movements. Conversely, a decreasing ATR might suggest a period of low volatility and possible consolidation.
Comparing Volatility Between Assets: Since ATR uses absolute values, it shouldn't be used to compare volatility between different assets, as assets with higher prices will consistently have higher ATR values, while assets with lower prices will consistently have lower ATR values. However, the addition of a trailing mean makes such a comparison possible. An asset whose ATR is consistently close to its ATR Trailing Mean will have a lower volatility than an asset whose ATR continuously moves far above and below its ATR Trailing Mean. This can help traders and investors decide which markets to trade based on their risk tolerance and trading strategies.
Determining Position Size: ATR can be used to adjust position sizes, taking into account the asset's volatility. Smaller position sizes might be appropriate for more volatile assets to manage risk effectively.

IKH Cloud V1.0 (nextSignals)The IKH Cloud V1.0 (nextSignals) is an Ichomoku-type indicator that can be used for various trading strategies. It's based on a ThinkScript study from @stephenharlinmd (aka nextSignals) that uses an instantaneous moving average as the base MA, and a custom trailing stop. Both of these components form the cloud.
Indicator Components and Calculation
The indicator comprises two key components:
Instantaneous Moving Average (IMA) : This is a type of moving average that places a greater weight on the most recent data points, and is based on Ehler's book "Rocket Science for Traders". This is slightly different from the Doc's original, but is very approximate.
Trailing Stop : This component helps determine the stop loss level that moves along with the price. The trailing stop is based on the highest high and the lowest low of the last 5 bars, as well as the simple moving averages of the low and high of the previous bar. The trailing stop is calculated separately for each condition: when the bar index is greater than 1 and when the previous 'a' variable is either 1 or 0.
These two components are used to create a filled area on the chart, also known as the 'cloud'. The color of the cloud and the candlesticks change based on the relative positions of the IMA and the trailing stop.
How to Use the Indicator
The following are just ideas on how to use this indicator, and is not financial advice in any form:
Trend Identification: When the IMA is above the trailing stop (cloud), it indicates an uptrend, and when it's below, it indicates a downtrend.
Entry/Exit Signals: Traders can consider going long when the candlesticks move above the cloud and short when they move below the cloud.
Stop Loss Level: The trailing stop line (the cloud's edge) can serve as a dynamic stop loss level.
Please don't use just this indicator on its own. Please use this in conjunction with other analysis tools, indicators, and systems you already have in place. Always consider the overall market context and use appropriate risk management strategies.
Scalper's toolkit - ATR WidgetWidget specifically designed for scalping. Many settings to fit the instrument and view preferences to make it fit into your chart window how you like, even on mobile.
** I have 5 other features to add into this in the very near future, as I use this as my primary tool for Risk reward. This script will be updated in the near future as more features are coded into it. See bottom for notes on plans
Features:
Displays a quick view of the ATR value on the chart, in decimal PIPs or directly in Points - a key value for scalping using the DOM for point value settings and one click trading on fast time frames.
Automatic calculation of stop and target distance for a predetermined Risk Reward Ratio (Set with the settings panel), and then also displayed in PIPs or Points for easy use in quick trading.
Works on most all instruments/pairs/cryptos with multiple precision levels for correct values to be shown in the widget.
Fully customizable -
ATR period Base setting, just like a normal ATR indicator
Display in : PIPs or Points
ATR based stop distance, using a multiplier. 2 is the most common multiplier used, and the default setting.
Risk Reward Calculation using the Stop Loss value.
-Quickly helps with proper target and stop sizing for the volatility in the price on the current trade entry point.
-Set to any ratio you wish, from 1:0.1 all the way to 1:100 or more, unlimited R ratio settings to fit your strategy and risk tolerances.
Position anywhere on the chart window with 9 preset locations available (Pine script limitation)
Show as a column layout or a row layout
Customize the Size, with 5 preset widget sizes, from tiny to huge (Pine script limitation)
-Mobile Friendly - Tiny or Small may be too small on PC, but can be used for Mobile so the widget does not become too large over the chart.
Custom text, background, and boarder colors
Custom Boarder Size - 0 size is no boarder
Set up:
-Open the settings panel.
First section is the basic settings for the ATR - the length (Default is 14) and to use a PIP value display, or Point value display.
Here you also see a "Precision" Setting. **Because each instrument returns different precision ATR values, it is difficult to determine with code what those values will be ahead of time to do the math in the background. Even some 2 decimal instruments return 5 decimal ATR values, so this setting filters that** Just use the dropdown and choose how many decimal places the instrument has from 2 - 5 decimals
The second section is for risk and reward calculations, and can be disabled if you do not want to see these values.
The first value is the "ATR Multiplier" Typically, a 2x multiplier is used on the ATR to determine how far away to place your stop loss from the entry, placing it out of harm's way from normal market activity.
The second value is the Reward target distance, based from the stop loss size. This quickly calculates your target to match your intended reward ratio, saving some manual work to calculate this by hand every trade.
** Note: because of the math used in the code, you may see odd values on some instruments, like indexes. If you have the precision correct, try changing the "Show in Pips" to "Show in Points", as this may solve the issue.
The last two sections are purely for how the widget looks and how/where it shows on the screen. These can be set however you like. To have no boarder, just set the "Frame size" value to 0.
Additional Updates planned:
Pip value calculation (2 feature uses)
-This will serve 2 purposes. The widget will calculate the value of the trade based on the lot size. It will also have a risk limit, so if the ATR get's too high for the current risk settings, It will show red to warn you of a high risk situation before you trade.
Example, you have a set limit of 3 dollars per trade using .02 lot sizing. If the ATR get's too high, The Stop value will be more risk than you would like to use at that trade sizing. Reduce the trade size, or wait for ATR to come lower.
Purpose 2: lot size calculation, so if you wanted to maximize the use of risk available. If you wanted to risk 600 for example, it would use the ATR you have set for the risk, and determine the proper lot size for the amount of volatility in the market. This way, you Risk Exactly, or as close as possible to 600 for the the current trade conditions.
Extra use for this value: Show the Current trade amounts at risk and for gain in money values on the side of the pip/point value. Know what you're risking and also trading for in monetary value.
ATR candle Comparison- Early momentum Detection (2 feature uses)
Will show an additional section on the bottom of the widget to show how each candle compares to the one before, up to the last 5, and show if ATR went down, up, or stayed the same over the last 5 candles.
Show an additional symbol to indicate the current candle status in comparison to the close of the last candle. Real time of if the ATR is getting larger, smaller, or staying the same.

Bar Color Long / Short Indicator With Advised SLOverview
This script is a trading indicator named "Bar Color Long / Short Indicator With Advised SL" designed for the TradingView platform. The indicator's primary purpose is to provide entry signals for long and short positions, based on various technical analysis methods. Additionally, the indicator suggests stop-loss levels for both long and short positions.
User Inputs
The indicator has several user inputs, such as:
Length
Smoothing
Multiplier
Show bar colors (ON/OFF)
When the bar colors are turned off, the alert signals for long and short positions will be displayed instead.
Custom Risk Calculation
The script calculates a custom risk level based on a modified version of the RSI (Relative Strength Index) formula. The custom risk level is divided into three categories: low, medium, and high.
Sentiment Score Calculation
The indicator calculates a sentiment score based on a combination of methods resembling EMA (Exponential Moving Average), MACD (Moving Average Convergence Divergence), and ROC (Rate of Change). The sentiment score is used to determine if the sentiment is positive or negative.
Bollinger Bands Percent and Combined Signal
The Bollinger Bands Percent is calculated, and the custom risk, sentiment score, and Bollinger Bands Percent are combined to generate a new signal. This signal is used in conjunction with EMA10 to determine the bar colors and provide entry signals.
Bar Colors
Based on the combined signal and EMA10, the script determines the bar colors as follows:
Orange: Positive sentiment
Blue: Negative sentiment
Gray: Neutral
Entry Signals and Alerts
When the bar colors are turned off, the indicator displays large green arrow signals for long (buy) positions and red arrow signals for short (sell) positions based on the sentiment and EMA10 conditions. The script also includes alert conditions for long and short signals, which can be used to set up notifications when these signals are triggered in the TradingView platform.
Advised Stop-Loss Levels
The indicator plots stop-loss lines for both long and short positions at the last candle, accompanied by labels showing the advised stop-loss levels in numeric values.
